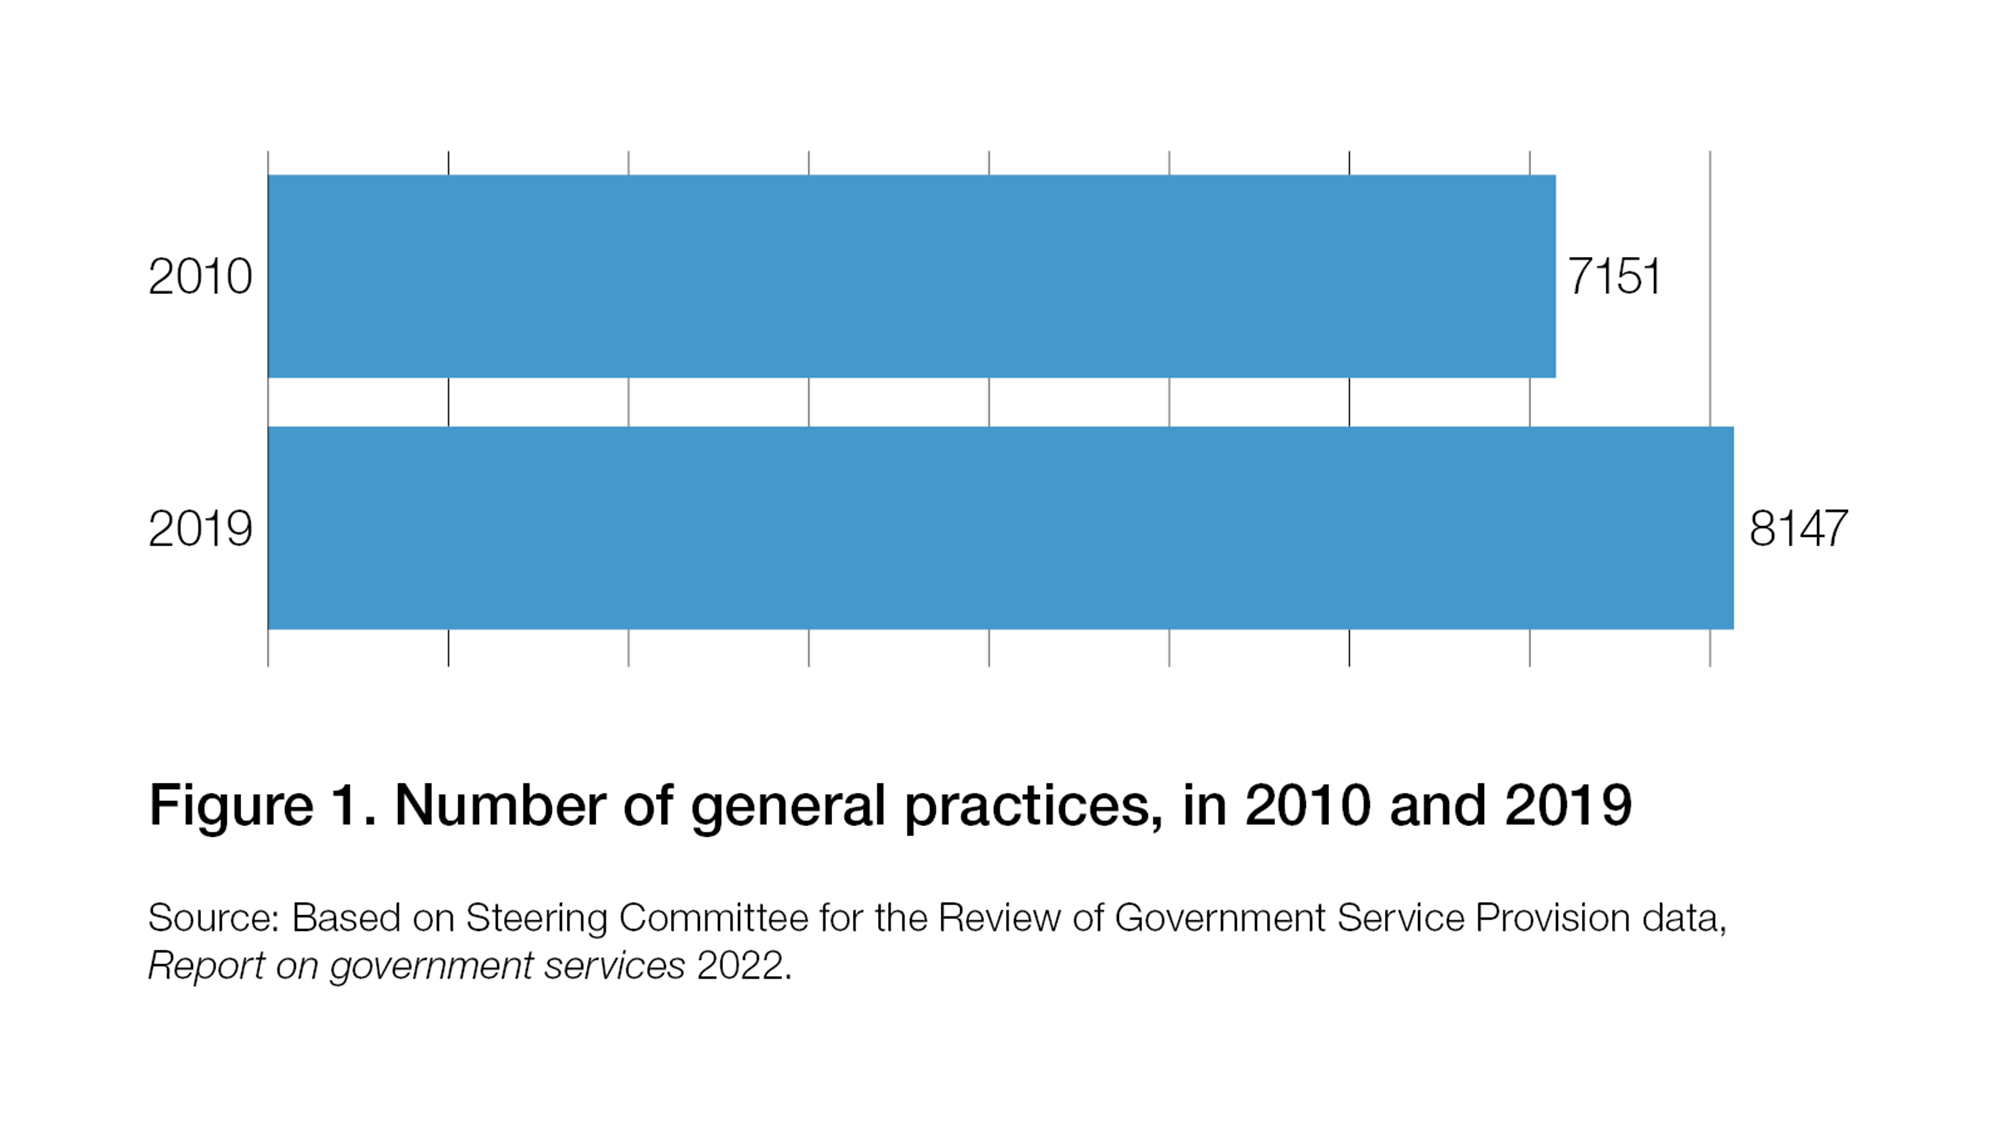
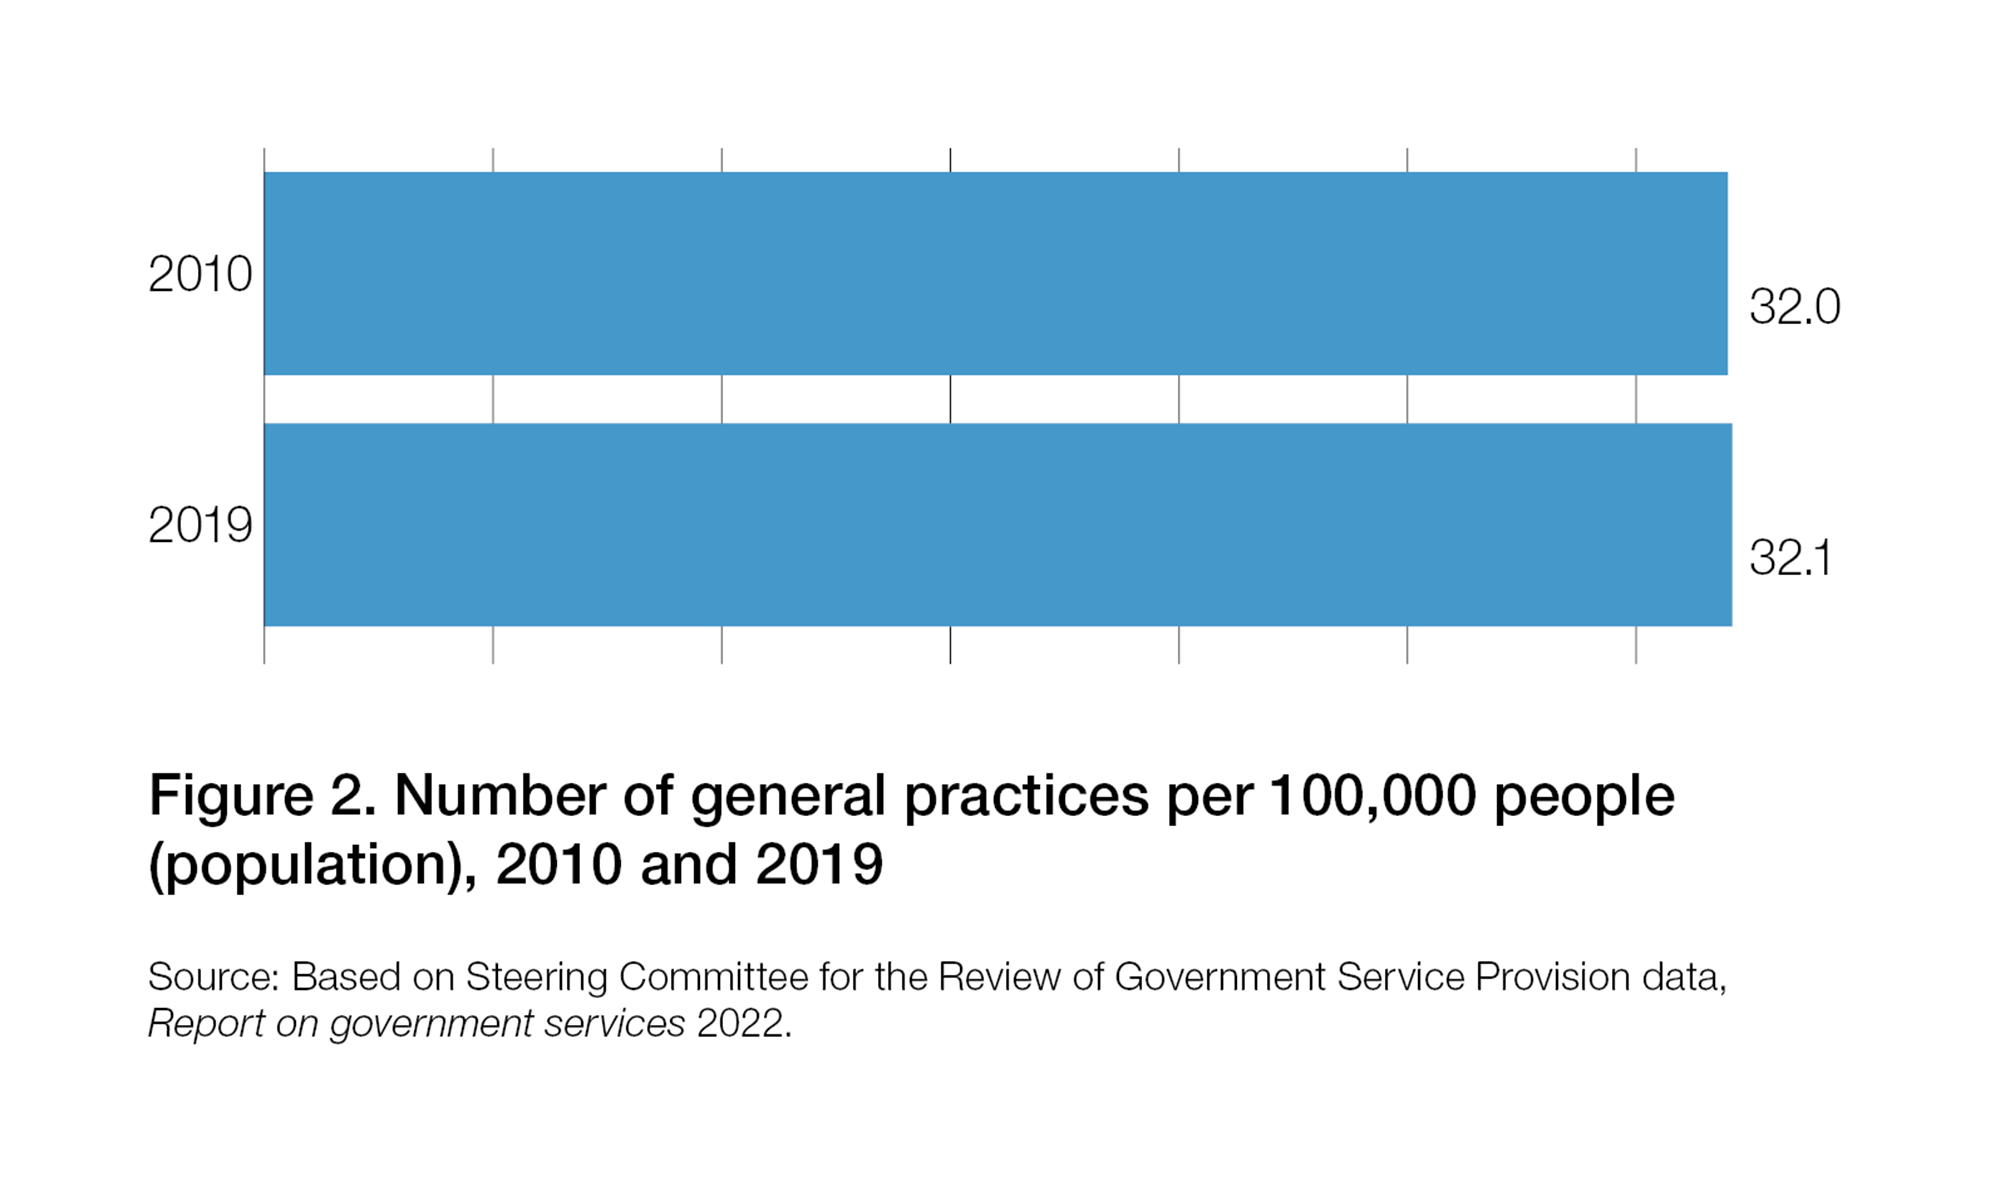
Table 1 summarises the overall number of general practices in Australia for the period 2010–2021. From 2010–2019, the overall number of general practices increased by 996. However, the number of practices remained relatively constant at 32 per 100,000 people, reflecting a commensurate increase in the Australian population during this time. The number and proportion of accredited general practices in Australia increased from 4812 (67.3%) in 2010 to 6825 (83.8%) in 2019: a 17% increase over the study period.
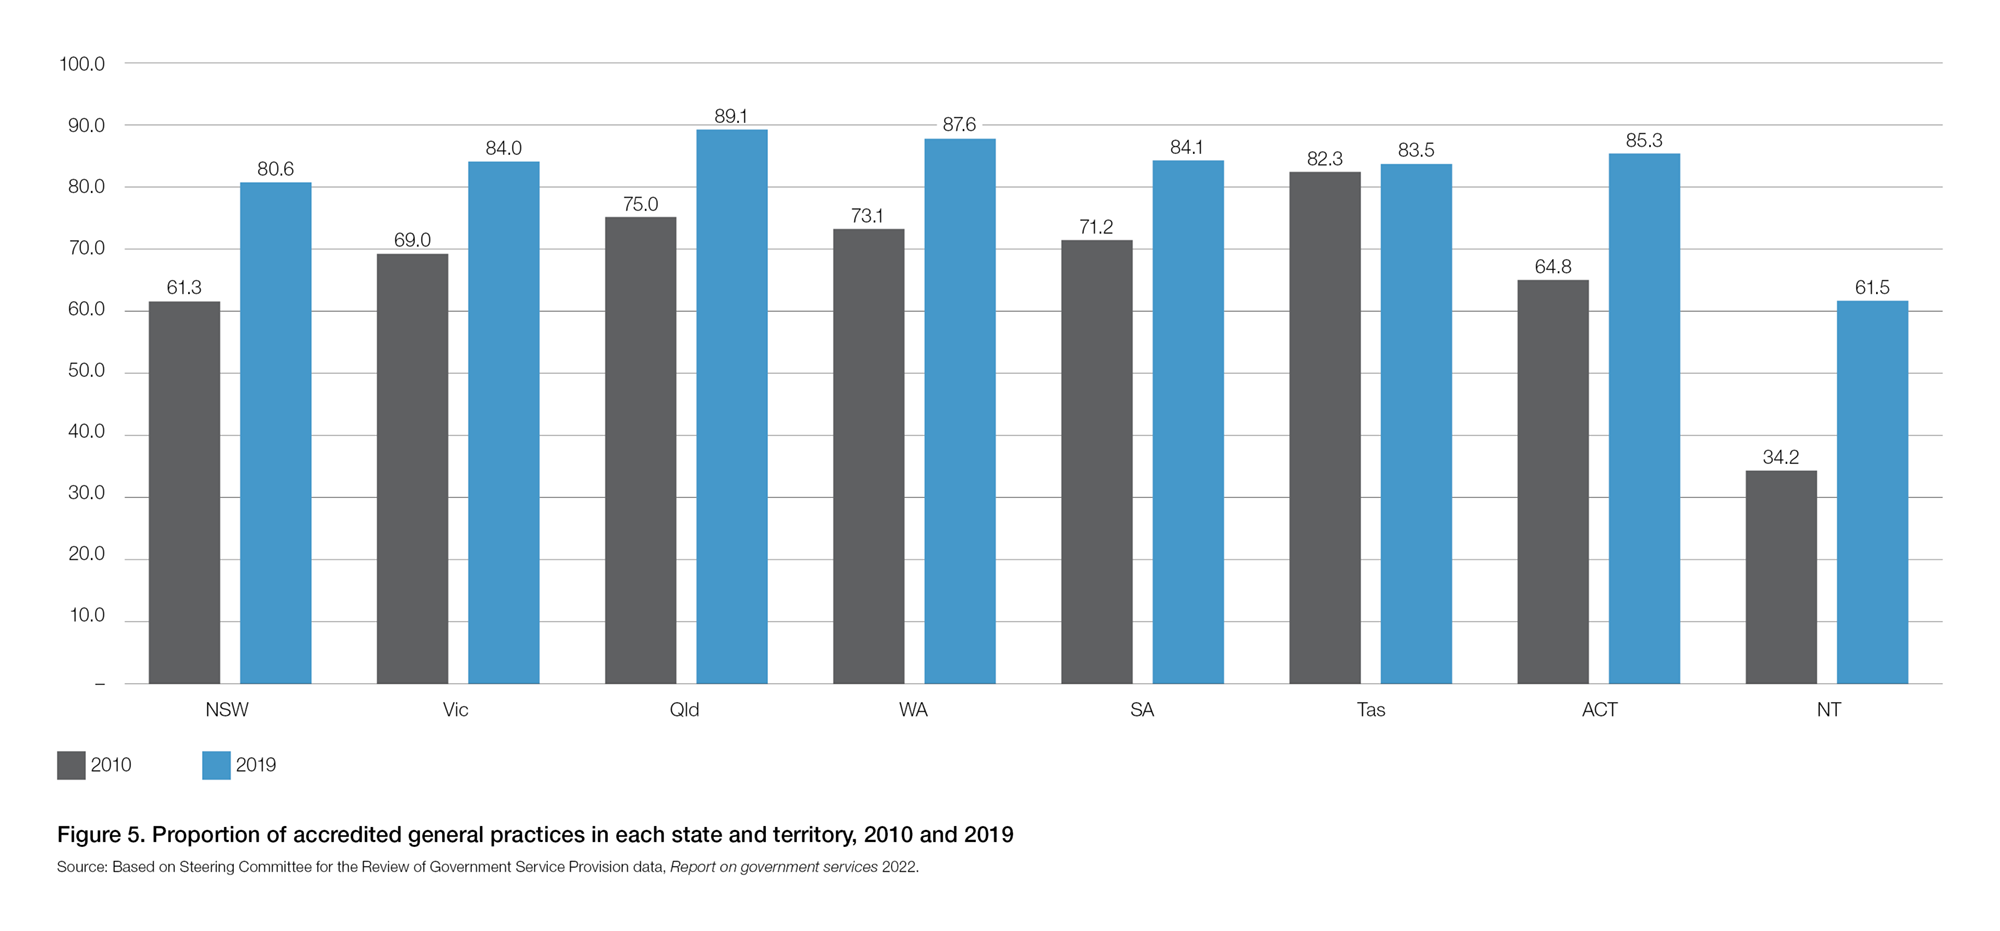
From 2010, the variability of the proportion of accredited general practices in each state and territory decreased. In 2010, the proportion of accredited practices ranged from 34.2% (Northern Territory) to 82.3% (Tasmania). Ten years later, the proportion of accredited practices in all states and territories was greater than 80%, except for the Northern Territory (61.5%). Despite having the lowest proportion of accredited practices in 2019, the Northern Territory had the largest increase in proportion of accredited practices of any state or territory from 2010.
The gap in the proportion of accredited practices between the Northern Territory and the next closest state, New South Wales, remains substantial. In the Northern Territory in 2019, 61.5% of practices are accredited, 19.1% fewer than in New South Wales (where 80.6% of practices are accredited).
Even in the states with a high proportion of accredited practices (Queensland 89.1%, Western Australia 87.6%, Australian Capital Territory 85.3%), more than 10% of practices are unaccredited.
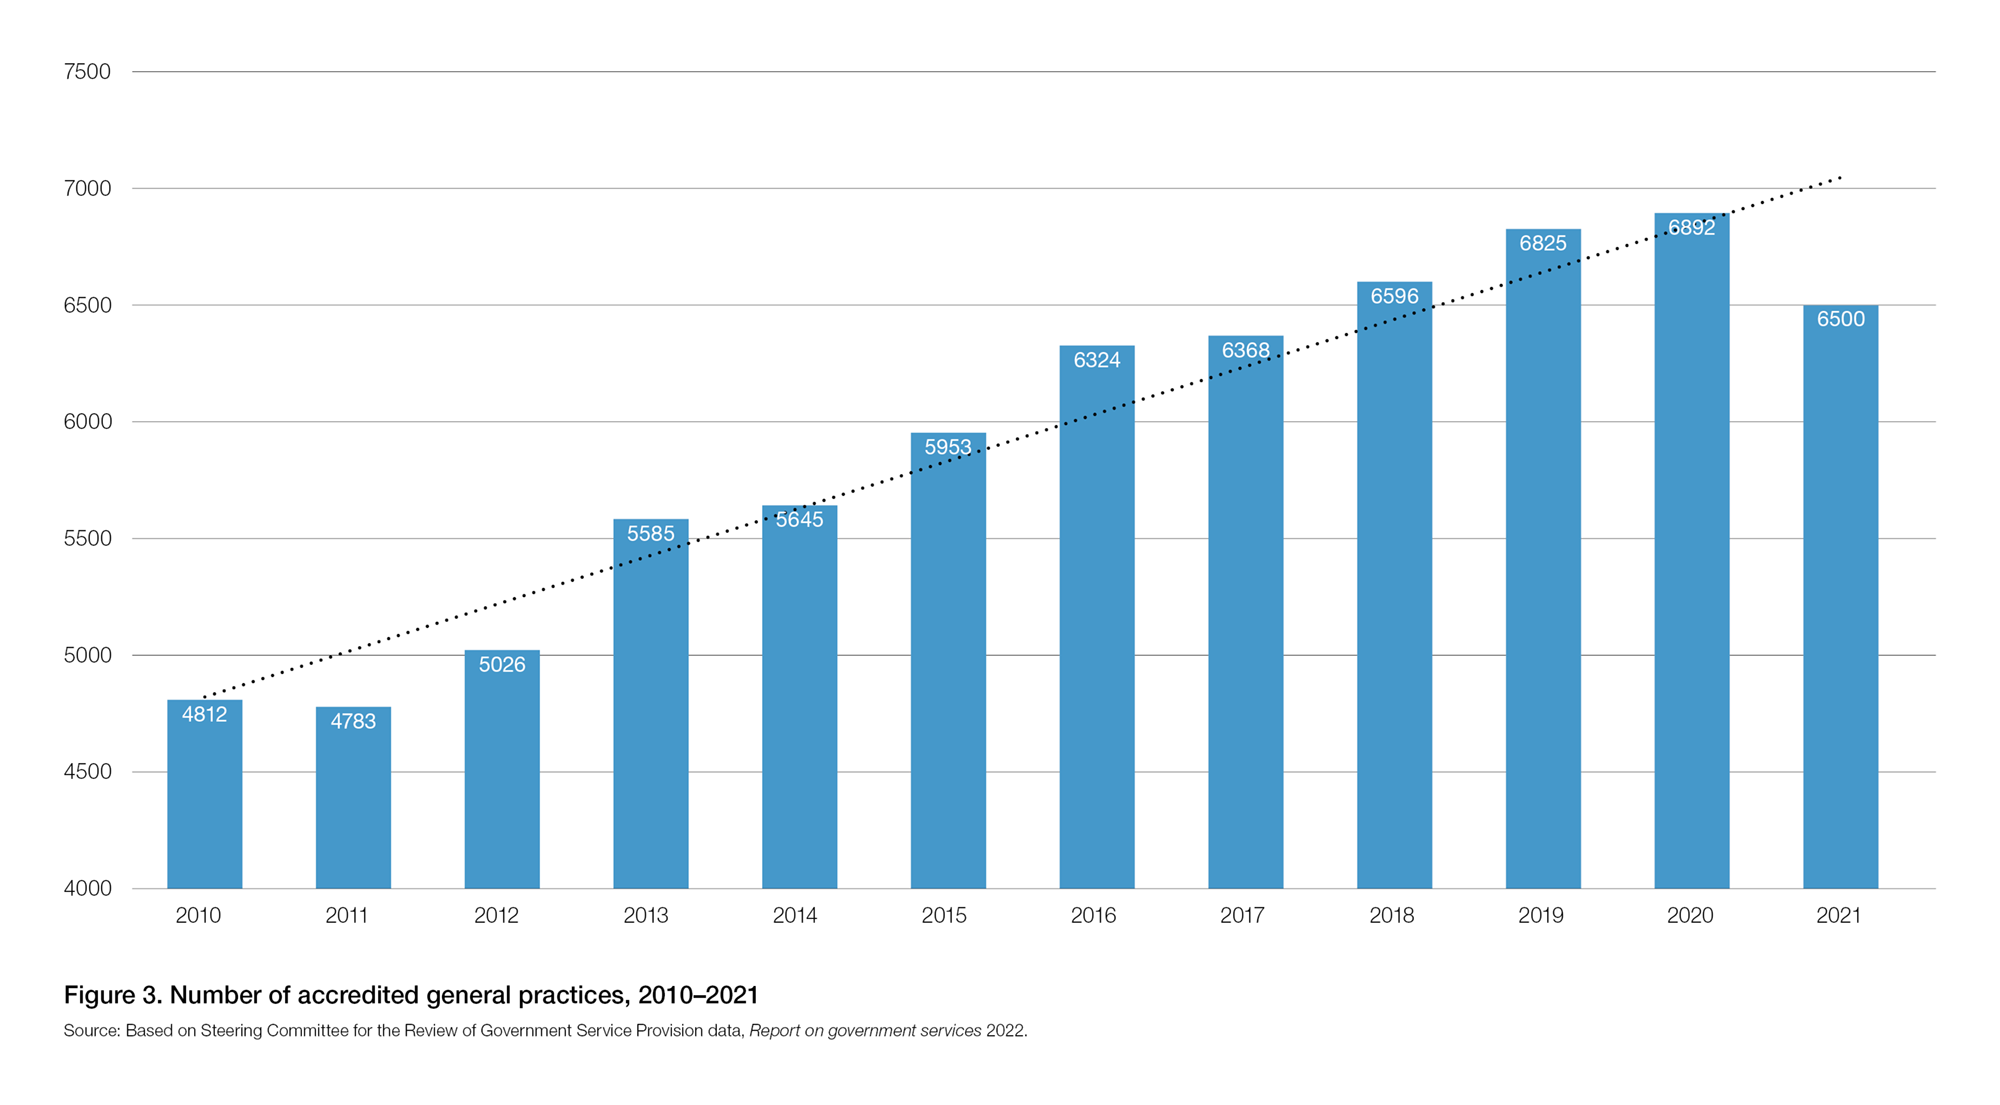
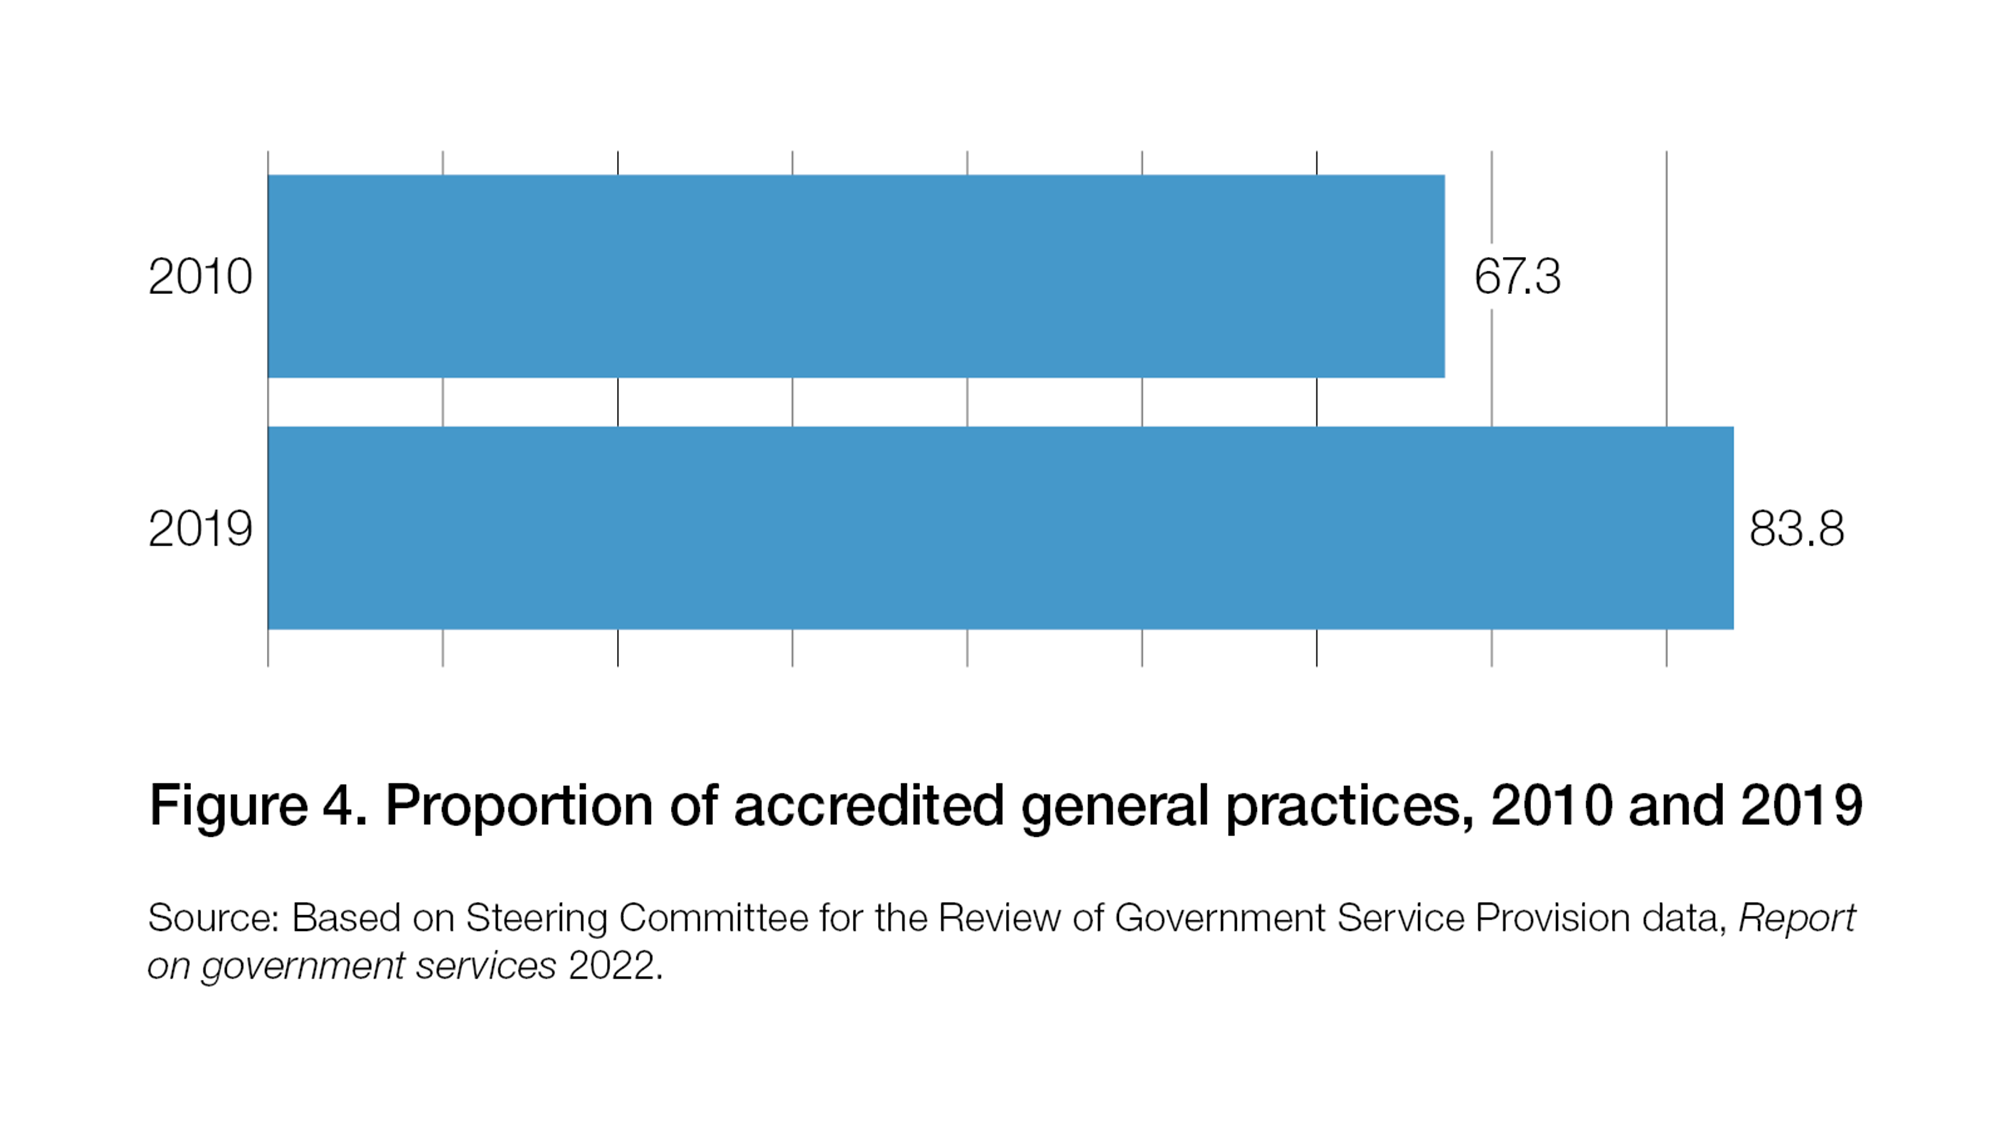
The number and proportion of accredited general practices in Australia increased from 4812 (67.3%) in 2010 to 6825 (83.8%) in 2019 – a 17% increase over the study period.
In 2010, the proportion of accredited practices ranged from 34.2% (Northern Territory) to 82.3% (Tasmania). Ten years later, the proportion of accredited practices in all states and territories was greater than 80%, except for the Northern Territory (61.5%).
Despite having the lowest proportion of accredited practices in 2019, the Northern Territory had the largest increase in proportion of accredited practices of any state or territory from 2010. In 2019, the gap in the proportion of accredited practices between the Northern Territory and the next closest state, New South Wales, remains substantial. In the Northern Territory in 2019, 61.5% of practices were accredited, 19.1% fewer than in New South Wales (where 80.6% of practices are accredited).
Even in the states/territory with a high proportion of accredited practices (Queensland 89.1%, Western Australia 87.6%, Australian Capital Territory 85.3%), more than 10% of practices are unaccredited.