The assessment of distance visual acuity is a core diagnostic measure of visual function. The first objective measure in any cranial nerve assessment is that of visual acuity.1 Traditionally, visual acuity testing is conducted using a Snellen wall chart, originally designed and used by Dutch Professor of Ophthalmology, Herman Snellen, in 1862.
Despite the popularity of the Snellen wall chart, there are a number of circumstances in which its application is impractical due to a required viewing distance of 6 metre (20 feet). Smaller Snellen charts have been designed to be viewed at shorter distances, with the 3-metre chart commonly seen in the primary care setting. Despite this, available distances can still be a problem, and the charts themselves are large, cumbersome and often lack mobility due to wall fixation. In circumstances such as the hospital ward or primary care setting, there is commonly limited access to a Snellen chart or available viewing distances. As a result, visual acuity is crudely assessed or often omitted during a complete physical examination, despite being clinically indicated.2 It has also been noted that visual acuity is often omitted in referrals to ophthalmology services from general practitioners (GPs).3
The emergence of mobile technology devices has seen an explosion in medical applications (apps) being available for little or no cost to anyone with a compatible device. A very high proportion of medical students and junior doctors have access and willingness to use such devices.4 It has been suggested that these apps will revolutionise point-of-care medicine, patient education, self-management of disease and remote monitoring.5 While the standardisation of visual acuity testing requires optimal conditions,6 practitioners assessing visual acuity in the non-standard setting have access to a large number of visual acuity apps. Currently, in the Australian App store, there are 76 Apple-specific apps available with the keyword ‘visual acuity’, 23 with ‘Snellen’ and 100 with ‘eye test’. Similar results are returned when searching Android applications. Hence, a plethora of options is available to healthcare professionals when considering the use of mobile technologies in the assessment of visual acuity.
Despite the significant number of options and recommendations for clinical use,7 there have been only three published studies to date comparing the use of Snellen wall charts with tablet devices,8–10 and no published studies that consider smartphones, or a comparison between tablet devices and smartphones. Furthermore, the above studies were all conducted in optometry clinics or the university environment, rather than at the bedside or primary care setting.
The aim of this study was to compare the results of a visual acuity test conducted using the standard 3-metre Snellen wall chart against those obtained from a visual acuity app presented on a tablet and a smartphone device in the context of the primary care setting.
Methods
The study was approved by the University of Wollongong and Illawarra Shoalhaven Local Health District Human Research Ethics Committee (GSM14/009), and was conducted in accordance with the Declaration of Helsinki. Participants were recruited through convenience sampling at a regional general practice. Exclusion criteria included:
- being under the age of 18 years
- being illiterate
- being unable to read or speak English
- not being able to complete the test due to disability
- presenting with an acute eye injury.
Testing modalities
Assessment of visual acuity was undertaken in three modalities:
- modality one – standard, non‑illuminated, 3-metre Snellen wall chart most commonly used in general practice11
- modality two – second-generation Apple iPad (9.7 inch screen) using the free application, Eye Chart Pro, version 1.3 by Dok LLC
- modality three – an Apple iPhone 4 (3.5‑inch screen) using the free application, Snellen, version 1.2 by Dr Bloggs Limited.
Both applications were available through the iTunes store, were modality-specific and scored an average user rating of four out of five.
Testing conditions
Testing was undertaken in a quiet room, separate from the waiting and consultation rooms, with ambient lighting levels that are standard for any medical centre consultation room. Lux measurements at the Snellen wall chart were 216 Ix and 254 lx for the iPad and iPhone. Brightness settings on the iPad and iPhone were set at 50%. The Snellen wall chart was hung at approximate eye height (1.65 metres above ground level) and markings were made on the ground at 3 metres from the wall (Snellen wall chart testing distance), 2.5 metres (iPad testing distance) and 1.2 metres (iPhone testing distance).
Testing procedures
Participants were instructed to stand on the testing area and asked to leave their lenses on if they were used for myopic correction. Each eye was assessed with the contralateral eye covered, and participants were asked to read from the top line down to the smallest line they could read. No time restrictions were placed on the participants. Each assessment end point was the correct identification of 50% + 1 letters on a line.6 The contralateral eye was tested in a similar fashion. This was repeated for each modality, with the researcher holding the mobile devices at the applications’ recommended distances for viewing. Each device displayed randomised letter combinations so as to prevent participant recall, and the order of modality assessment was also randomised between participants. All assessments were performed by the same researcher to eliminate inter-tester variability issues.
Results were recorded, initially as 6/X fraction and then converted to an equivalent logarithm of minimum angle of resolution (logMAR)12 score for statistical analysis. LogMAR charts are based on a geometric progression of letter sizes on each line, and scores are based on the total of all letters read. The visual acuity intervals on the Snellen wall chart were 6/60, 6/36, 6/24, 6/18, 6/12, 6/9, 6/6, 6/5, and 6/4, and the intervals for both mobile devices were 6/60, 6/30, 6/21, 6/15, 6/12, 6/9, 6/7.5, 6/6 and 6/4.5. Optotypes varied between modalities, with mobile apps using a Sloan glyphs font and the Snellen wall chart using Landolt broken rings font. While noticeably different, they are considered to have equal recognition difficulty.6
Results
Sixty participants (mean age 54.5 years ±15 standard deviation [SD], range 24–88 years of age) had their visual acuity assessed three times (once on each test modality). This resulted in a total of 120 eyes being assessed, giving a total of 360 eye assessments. Participants consisted of 26 males and 34 females; 15 participants had corrected vision.
Assessment of visual acuity found mean logMAR scores (Table 1) of:
- Snellen wall chart: 0.233 ± 0.196 (left eye) and 0.217 ± 0.185 (right eye)
- iPhone: 0.238 ± 0.237 (left eye) and 0.217 ± 0.208 (right eye)
- iPad: 0.227 ± 0.240 (left eye) and 0.198 ± 0.216 (right eye).
The logMAR scores were subjected to an intraclass correlation coefficient (ICC) as a general measurement of agreement between the visual acuity assessment scores derived from the three levels of testing modality (Snellen wall chart, iPhone and iPad). A high degree of correlation was found between logMAR measurements recorded between testing modality (devices). The average ICC measure was 0.917, with a 95% confidence interval of 0.887–0.940 (F[119, 238] = 12.009, P <0.05). A comparison between the average of the iPad and iPhone logMAR scores and the Snellen wall chart scores is illustrated in Figure 1.
Table 1. Combined logMAR scores for each testing modality
|
|
Descriptive statistics
|
|---|
| | n | Minimum | Maximum | Mean | Standard deviation |
|---|
| iPhone (left eye) |
60 |
–0.20 |
0.70 |
0.238 |
0.237 |
| iPhone (right eye) |
60 |
–0.20 |
0.70 |
0.217 |
0.208 |
| iPad (left eye) |
60 |
–0.20 |
0.70 |
0.227 |
0.240 |
| iPad (right eye) |
60 |
–0.20 |
1.00 |
0.198 |
0.216 |
| Snellen (left eye) |
60 |
0.00 |
0.70 |
0.233 |
0.196 |
| Snellen (right eye) |
60 |
–0.20 |
0.70 |
0.217 |
0.185 |
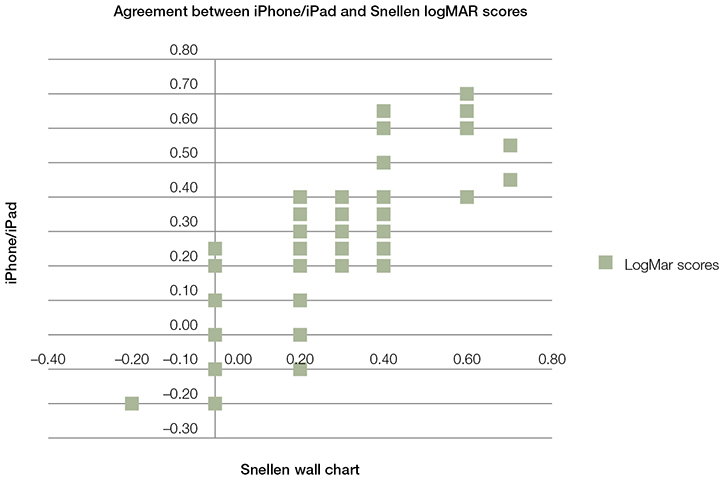 |
| Figure 1. Comparison of visual acuity performance for the average logMAR score for the iPhone and iPad against the Snellen wall chart |
Discussion
The assessment of visual acuity in the primary care setting will never substitute regular, formal assessment in optometry and ophthalmology clinics.13 However, when clinically indicated (ie in an acute presentation), it must be performed in a quick and easy fashion. Clinical examination is often considered a ‘lost art’ as a result of technology,14 yet in this context technology may in fact enable a return to traditional medicine.
Statistical analysis showed a high level of agreement between the logMAR scores recorded through the three testing modalities, suggesting that in the context of primary care visual acuity assessment, either type of mobile technology will give a result comparable to that of the traditional 3-metre Snellen wall chart.
The three published studies that assessed iPad alone suggested that there is agreement between traditional testing modalities and iPad apps, although two of the studies stated condition limitations. Zhang et al (2013)8 stated that visual acuity agreement between modalities is only accurate when visual acuity is better than 20/200 (6/60) in participants. Our study did not test beyond this as both apps and the Snellen wall chart had optotypes no larger than 6/60, and none of our participants had visual acuity worse than 6/60.
Another study suggested that the assessments could be in agreement on the condition that glare was eliminated from the iPad screen.9 The iPad brightness setting in their study was set to the maximum level (100%), and after the first round of testing and analysis, the researchers decided a glare filter was required. In our study, the brightness setting was set at 50%. Interestingly, the issue of glare was not raised at any stage by participants, suggesting that the ambient lighting conditions in our study may have been more favourable than in the previous study,9 and that attenuation of brightness levels was all that was required. In another study, the brightness level was set at 75%, and a glare filter was not required to obtain accurate visual acuity measurements.10 That study also demonstrated unconditional agreement between the Snellen wall chart and iPad.10
Our study differed significantly from the aforementioned studies in a number of ways. While universally demonstrating agreement between traditional visual acuity assessment and mobile technologies, our Snellen wall chart was designed to be viewed at 3 metres rather than 6 metres. Our Snellen wall chart was a simple cardboard poster with no built-in illumination, commonly found in primary care settings throughout the world, whereas the previous studies used externally or internally illuminated light boxes as a control. The apps used in our study (Snellen and Eye Chart Pro) were a different brand or version from those used in the previous studies. Our exclusion criteria demonstrated the ‘real world’ nature of primary care while minimum visual acuity,8 English as a second language10 and self-identified ocular pathology9 were excluded in previous studies.
Limitations of our study include transferability of results using different software and different devices. Our results only hold true for the Snellen app being used on the iPhone 4 and Eye Chart Pro app being used on the second-generation iPad. Optotypes were not consistent between mobile technologies and the Snellen wall chart, and this was commented on by a number of participants who perceived this as a methodical flaw, despite evidence to the contrary.6
A number of participants also complained of sore eyes or visual fatigue, suggesting an effort-induced asthenopia. Completing three consecutive visual acuity assessments was demanding on participants, but as the order of testing was changed between participants, this should not have affected results.
As exact viewing distances were measured for each modality, an assessment of such technology on the hospital ward needs to consider the examiners’ ability to judge or ‘guess’ suggested modality-viewing distances. It is also acknowledged that the efforts to eliminate inter-tester variability issues may have introduced a potential source of bias during the visual acuity assessment on subsequent testing modalities.
Conclusion
This research demonstrates validity for the use of mobile technologies in the assessment of visual acuity, and the consistency between two forms of
mobile technology with varying screen size and applications in a primary care setting.
Implications for general practice
- Whether on the wards, in the emergency department or in the general practice surgery, the similarity in assessment outcomes between testing modalities offers clinicians the confidence to use mobile technology devices and apps for visual acuity testing.
- This newfound convenience should increase the frequency of visual acuity assessments, potentially identifying ocular or neurological pathology at an earlier stage and resulting in timely, appropriate referral.
Authors
Samuel O’Neill MBBS, BEc, BMedSci, Junior Medical Officer, Blacktown Hospital, NSW
Darryl J McAndrew, PhD, MSc (OH&S), Senior Lecturer, Graduate School of Medicine, School of Medicine, Faculty of Science, Medicine and Health, University of Wollongong, Wollongong, NSW. mcandrew@uow.edu.au
Competing interests: None.
Provenance and peer review: Not commissioned, externally peer reviewed.