Socioeconomic disadvantage has a known effect on health, with less advantaged Australians self-reporting poorer health than those classified as more advantaged.1 The least advantaged Australians see general practitioners (GPs) more often than do other Australians.1 However, little is known about differences in GP encounters with patients from different socioeconomic backgrounds. This article will address this knowledge gap by comparing the content of general practice encounters for the most and least socioeconomically advantaged patients.
Method
Data from the Bettering the Evaluation and Care of Health (BEACH) program were analysed using weighted data for the period April 2014 to March 2015. Detailed methods for BEACH have been described in an earlier paper in this series.2 Briefly, BEACH is a continuous national study of general practice activity, in which approximately 1000 GPs are randomly selected for participation each year. Each participant provides information about 100 consecutive patient encounters.
In this study, the socioeconomic status (SES) for each patient was determined using patients’ residential postcodes mapped to the Socio-Economic Indexes for Areas (SEIFA; index of advantage and disadvantage).3 ‘Low SES’ was defined as deciles 1–3 (indicating relatively low level of advantage and high level of disadvantage), and ‘high SES’ was defined as deciles 8–10 (indicating relatively high level of advantage and low level of disadvantage). Because of the differences in age distributions of patients in the two groups, additional analysis was undertaken to age-standardise the results. Differences produced by age-standardisation are reported when the results differed from the initial weighted results. The results reported in this article are mostly not age-standardised, as age standardisation did not significantly alter most of the differences shown in the analysis of non-standardised weighted data.
Results
There were 57,235 GP–patient encounters in this analysis, of which 21,547 (37.6%) were with patients classified as low SES or most disadvantaged.
The age distributions of patients differed between the two groups. Compared with the low SES group, larger proportions of patients in the high SES group were aged 1–4 years (4.9% versus 3.7%), 5–14 years (5.7% versus 4.5%) and 25–44 years (24.1% versus 20.1%). A larger proportion of patients in the low SES group were aged 65–74 years, compared with the high SES group (16.8% versus 12.5%; Figure 1).
Low SES patients more often had a healthcare card (59.7%; 95% confidence interval [CI]: 57.4–62.1) than high SES patients (34.7%; 95% CI: 32.6–36.8). Nearly five times as many patients in the low SES group were from an Aboriginal and/or Torres Strait Islander background (2.9%; 95% CI: 1.9–4.0) than in the high SES group (0.6%; 95% CI: 0.4–0.7; Figure 1).
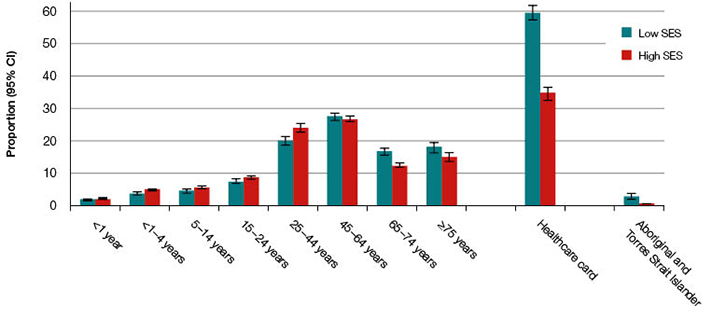
Figure 1. Selected patient demographics: Low versus high socioeconomic status (SES)
CI, confidence interval
There was no difference in the overall rate of problems managed between the two groups, but chronic problems were managed at a significantly higher rate at encounters with low SES patients (61.3 per 100 encounters; 95% CI: 57.3–65.2) than for high SES patients (49.8 per 100 encounters; 95% CI: 47.2–52.4; results not tabled). Hypertension was the problem most frequently managed at general practice encounters for low and high SES patients (8.6 and 7.2 per 100 encounters respectively), with no difference in management rate between the groups. Diabetes, back complaints, osteoarthritis and gastro-oesophageal reflux disease (GORD) were all managed more often in low SES patients than in high SES patients (Figure 2). Age-standardisation removed differences in the management rates of back complaints, osteoarthritis and GORD.
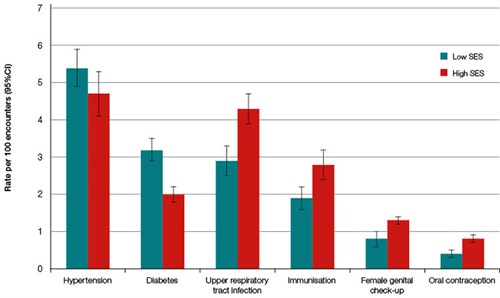
Figure 2. Selected problems managed: Low versus high socioeconomic status (SES)
CI, confidence interval
By contrast, upper respiratory tract infections (URTI) and immunisations were managed significantly less often in low SES patients than in high SES patients (Table 1). Female genital check-ups (1.2 versus 1.9 per 100 encounters) and oral contraception (0.7 versus 1.3 per 100 encounters) were also managed less often at encounters with low SES patients than for high SES patients. These issues were also all given as reasons for encounter less often by low SES patients (Figure 2).
Medications were prescribed at a higher rate at encounters with low SES patients than with high SES patients (58.2 versus 52.8 per 100 problems). Referrals were given at a lower rate for low SES patients than for high SES patients (9.4 versus 11.3 per 100 problems), reflected in referrals to medical specialists (Table 2), particularly to gastroenterologists, dermatologists, and ear, nose and throat (ENT) surgeons (results not tabled).
Table 1. Most frequent problems managed in general practice by socioeconomic status
|
Problem managed
|
Low socioeconomic status (SES) patients
Rate per 100 encounters
(95% confidence interval [CI])
|
High SES patients
Rate per 100 encounters
(95% CI)
|
|---|
|
Hypertension*
|
8.6 (7.7–9.5)
|
7.2 (6.6–7.8)
|
|
Diabetes *†
|
5.0 (4.6–5.5)
|
3.0 (2.7–3.3)
|
|
Upper respiratory tract infection†
|
4.6 (4.0–5.2)
|
6.6 (6.0–7.2)
|
|
Depression*
|
4.4 (3.9–4.9)
|
4.4 (4.1–4.7)
|
|
Back complaint *†
|
3.8 (3.4–4.2)
|
2.9 (2.7–3.2)
|
|
Osteoarthritis *†
|
3.6 (3.1–4.0)
|
2.5 (2.3–2.8)
|
|
Gastro-oesophageal reflux disease *†
|
3.3 (2.9–3.7)
|
2.5 (2.3–2.8)
|
|
General check-up *
|
3.1 (2.7–3.5)
|
2.9 (2.6–3.2)
|
|
Immunisation (all) *†
|
3.1 (2.6–3.6)
|
4.3 (3.8–4.7)
|
|
Prescription (all)*
|
3.0 (2.3–3.6)
|
2.5 (2.2–2.9)
|
|
Lipid disorders*
|
3.0 (2.3–3.4)
|
3.0 (2.7–3.3)
|
|
*Includes multiple International Classification of Primary Care-2 (ICPC-2) and/or ICPC-2 PLUS codes
†Indicates a statistically significant difference between groups
|
Table 2. Selected management actions undertaken in general practice by socioeconomic status
|
Management action
|
Low socioeconomic status (SES) patients
Rate per 100 problems
(95% confidence interval [CI])
|
High SES patients
Rate per 100 problems
(95% CI)
|
|---|
|
Prescribed medication>*
|
58.2 (55.5–60.9)
|
52.8 (51.0–54.7)
|
|
Referrals*
|
9.4 (8.8–10.0)
|
11.3 (10.7–11.8)
|
|
Referrals to medical specialists*
|
5.3 (4.9–5.7)
|
7.1 (6.7–7.4)
|
|
Other treatments
|
31.0 (28.5–33.4)
|
34.1 (32.0–36.2)
|
|
Clinical treatments
|
19.6 (17.5–21.7)
|
23.6 (21.7–25.4)
|
|
Procedures
|
11.3 (10.4–12.3)
|
10.5 (10.0–11.1)
|
|
Pathology orders*
|
28.1 (26.2–30.1)
|
32.4 (30.7–34.1)
|
|
Imaging orders
|
7.1 (6.6–7.6)
|
7.7 (7.3–8.2)
|
|
*Indicates a statistically significant difference between groups
|
The rate at which psychological counselling was performed at general practice encounters was lower for low SES patients (1.7 per 100 problems; 95% CI: 1.4–1.9) than for high SES patients (2.3 per 100 problems; 95% CI: 2.0–2.5; results not tabled). Although there was no overall difference in the rate of referrals to allied health professionals, referral rates to psychologists were lower for low SES patients (0.7 per 100 problems; 95% CI: 0.6–0.8) than for high SES patients (1.0 per 100 problems; 95% CI: 0.8–1.1), but this difference disappeared when the results were age-standardised.
Encounters with low SES patients resulted in fewer pathology orders (Table 2) and Pap smears (0.4 per 100 problems; 95% CI: 0.3–0.6 versus 0.7 per 100 problems; 95% CI: 0.6–0.8; results not tabled) when compared with high SES patients.
Discussion
This study provides an overview of the care provided to patients at GP encounters according to socioeconomic disadvantage. A number of problems managed at lower rates at encounters with low SES patients were preventive in nature, namely immunisations, female genital check-ups and oral contraception. As these issues were also given as reasons for seeking care less often by low SES patients, GPs may need to remind more disadvantaged patients about the need for preventive activities. These patients may also benefit from education about preventive care.
The higher rate of chronic problems managed may explain the higher rate of medications prescribed at encounters with low SES patients. By contrast, pathology orders and referrals to specialists were given at lower rates for low SES patients than for high SES patients. The latter may reflect previous research, which found visit rates to specialists were lower among more disadvantaged Australians,4,5 and may indicate a cost barrier to more disadvantaged patients accessing these services.
There was no difference observed in the rate of psychological problems managed according to the patient’s socioeconomic disadvantage. However, there was less psychological counselling provided to the most disadvantaged patients and lower rates of referrals to psychologists (although the latter difference disappeared when the results were age-standardised). Although the Better Access to Mental Health Care initiative provides Medicare Benefits Schedule (MBS) rebates for mental health services,6 analysis shows that through this initiative, less advantaged Australians had fewer consultations with clinical psychologists than those who were more advantaged.7 The cross-sectional design of BEACH means that we were unable to identify patients who may previously have been referred to psychological services through the Better Access scheme. Similarly, differences in attendance patterns have implications for data collected through cross-sectional studies.
Findings from this study show some differences in patient profile, problems managed and treatments provided on the basis of socioeconomic disadvantage, notably the potential for greater focus on preventive activities for low SES patients. This study also reflects the continuing problem with equity of access to health services by vulnerable patient groups of low SES.
Authors
Julie Gordon BAppSc (HIM) (Hons), PhD, Research Fellow, School of Public Health, Sydney Medical School, University of Sydney, NSW
Lisa Valenti BEc, MMedStat, Honorary (and formerly) Senior Research Analyst for the BEACH program, School of Public Health, Sydney Medical School, University of Sydney, NSW
Clare Bayram BAppSc (HIM) (Hons), PhD, Honorary Research Fellow and (formerly) Project Manager of the BEACH program, School of Public Health, Sydney Medical School, University of Sydney, NSW
Graeme C Miller, MBBS, PhD, FRACGP, Honorary Associate Professor and (formerly) Medical Director of the BEACH program, School of Public Health, Sydney Medical School, University of Sydney, NSW
Competing interests: None.
Provenance and peer review: Commissioned, externally peer reviewed.
Acknowledgements
We wish to thank the general practitioners who participated for their generosity. During the data collection period of this study, the BEACH program was funded by the Australian Government Department of Health, AstraZeneca Pty Ltd (Australia), Novartis Pharmaceuticals Australia Pty Ltd, bioCSL (Australia) Pty Ltd, AbbVie Pty Ltd and the Australian Government Department of Veterans’ Affairs. Funding organisations had no editorial control over any aspect of this article.