There is little published information about the prevalence, demographics and impairment of patients who report chronic neuropathic pain at encounters in Australian general practice. Most national and international prevalence studies are population-based, site-specific or condition-specific. A study in the UK reported a prevalence of 8.0% for chronic pain with neuropathic symptoms.1 A previous Bettering the Evaluation and Care of Health (BEACH) sub-study reported a 6.6% prevalence of formally diagnosed neuropathic pain (not necessarily chronic) among patients at general practitioner (GP) encounters; a further 1.9% had symptoms of (undiagnosed) neuropathic pain.2 The lack of relevant published Australian studies has motivated this further research.
This study examines, in more detail than the previously published summary,3 the statistical association of patients in Australia who report chronic pain (grouped as neuropathic or nociceptive [non-neuropathic, musculoskeletal]) and their sex, age-group and Socio‑Economic Indexes for Areas (SEIFA)4 status. It also compares self-reported pain intensity, activity level, sleep quality and mood scores of respondents with neuropathic or nociceptive pain, using definitions and self-scoring scales previously published.3,5
To assess recent concerns about the appropriate use of pregabalin (an anticonvulsant indicated for use in neuropathic pain), we also investigated current pregabalin use by patients in the neuropathic and nociceptive groups. A study by the Pharmaceutical Benefits Scheme’s (PBS’s) Drug Utilisation Sub-committee estimated that from March 2013 to February 2015, 25% of eligible patients with neuropathic pain would receive pregablin during the first year after PBS listing. PBS expenditure (including the repatriation scheme) was approximately $61 million for the first year of listing, and $106 million for the second year.6 Earlier BEACH analyses found that pregabalin was prescribed at a rate of 0.5 per 100 problems (of all types) managed in general practice in 2014–15,7 and that 8.2% of patients with chronic pain were taking pregabalin.3 However, there was no breakdown of prescribing by neuropathic versus non-neuropathic pain.
Methods
BEACH methods have been described in detail previously.8 For this sub-study, which involved 97 GPs between February and March 2015, all respondents at patient encounters surveyed about chronic pain over the preceding six months were grouped into those with:
- neither neuropathic nor nociceptive (musculoskeletal) chronic pain, labelled as ‘no chronic pain’
- ‘neuropathic chronic pain’, with or without nociceptive chronic pain
- ‘nociceptive chronic pain only’ (ie no report of neuropathic chronic pain).
All definitions required by the GPs and patients were included on a card sent with the sub-study questionnaire, including:
Nerve (neuropathic) pain = caused by actual nerve damage, often described as a burning, electric shock, shooting, numbness, itching or pins & needles.3
For each of these three mutually exclusive groups, statistical associations with sex, age group and SEIFA status were analysed in SAS 9.3 to provide frequency distributions and characteristic-specific rates, as well as 95% confidence intervals (CIs) corrected for statistical clustering around each participating GP. P values were obtained from the Rao-Scott chi-square statistic for dichotomous variables and univariate logistic regression for age groups.
Pain intensity, activity level, sleep quality and mood scores of respondents in the neuropathic group were compared with those in the nociceptive group using univariate linear regression corrected for clustering. We also compared current pregabalin use in each group.
Ethics approval for the BEACH program was obtained from the Human Research Ethics Committee of the University of Sydney (approval number HREC 2012/130).
Results
The age and sex distributions of patients in this study were not significantly different from those of patients at BEACH 2014–15 encounters. Of the 2848 patients sampled at encounters in this study, a quarter (n = 722; 25.4%) reported having chronic pain over the preceding six months. One-fifth of these patients (n = 147; 5.2% of the total patients sampled) described chronic neuropathic pain (alone or in combination with nociceptive pain). The other four-fifths (n = 575; 20.2% of the total patients sampled) reported chronic nociceptive pain alone (Table 1).
Table 1. Distribution of chronic pain diagnoses
|
Main group
|
Subgroup
|
Subdivision
|
n
|
Per cent (95% confidence interval)
|
|---|
|
All respondents
|
|
|
2,848
|
100.0
|
|
No chronic pain
|
|
|
2,126
|
74.6 (71.4–77.9)
|
|
All chronic pain
|
|
|
722
|
25.4 (22.1–28.6)
|
| |
All neuropathic pain
|
|
147
|
5.2 (4.1–6.2)
|
| |
|
Neuropathic and nociceptive pain
|
97
|
3.4 (2.5–4.3)
|
| |
|
Neuropathic pain only
|
50
|
1.8 (1.2–2.3)
|
| |
Nociceptive pain only
|
|
575
|
20.2 (17.3–23.0)
|
The frequency distributions are shown in Table 2. Of those with chronic pain, just over half were ≥65 years of age, about two-thirds were female, and there were approximately equal numbers from low and high SEIFA groups.
Table 2. Distribution of age, sex and Socio-Economic Indexes for Areas status among respondents and pain groups
|
Characteristic
|
Value
|
All respondents
n (%)
|
All chronic pain
n (%)
|
Neuropathic
n (%)
|
Nociceptive
n (%)
|
|---|
|
Age group (years)
|
<1
|
54 (1.9)
|
0 (0.0)
|
0 (0.0)
|
0 (0.0)
|
|
(Missing = 13)
|
1–4
|
99 (3.5)
|
0 (0.0)
|
0 (0.0)
|
0 (0.0)
|
| |
5–14
|
148 (5.2)
|
0 (0.0)
|
0 (0.0)
|
0 (0.0)
|
| |
15–24
|
234 (8.3)
|
8 (1.1)
|
2 (1.4)
|
6 (1.1)
|
| |
25–44
|
622 (21.9)
|
87 (12.1)
|
26 (17.8)
|
61 (10.7)
|
| |
45–64
|
745 (26.3)
|
213 (29.7)
|
50 (34.2)
|
163 (28.5)
|
| |
65–74
|
443 (15.6)
|
175 (24.4)
|
27 (18.5)
|
148 (25.9)
|
| |
≥75
|
490 (17.3)
|
234 (32.6)
|
41 (28.1)
|
193 (33.8)
|
| |
Total
|
2835 (100.0)
|
717 (100.0)
|
146 (100.0)
|
571 (100.0)
|
|
Sex
|
Male
|
1140 (40.2)
|
249 (34.6)
|
47 (32.0)
|
202 (35.3)
|
|
(Missing = 12)
|
Female
|
1696 (59.8)
|
470 (65.4)
|
100 (68.0)
|
370 (64.7)
|
| |
Total
|
2836 (100.0)
|
719 (100.0)
|
147 (100.0)
|
572 (100.0)
|
|
Socio-Economic Indexes for Areas
|
1–5 (low)
|
1140 (40.8)
|
351 (49.6)
|
69 (47.6)
|
282 (50.1)
|
|
(Missing = 55)
|
6–10 (high)
|
1653 (59.2)
|
357 (50.4)
|
76 (52.4)
|
281 (49.9)
|
| |
Total
|
2793 (100.0)
|
708 (100.0)
|
145 (100.0)
|
563 (100.0)
|
|
1–5 (low): relative disadvantage4
|
Age-specific rates are shown in Figure 1. Chronic pain was reported only in those aged ≥15 years; rates increased with age. Of those in the ≥75 age group, almost half reported chronic pain. For neuropathic pain, the rates increased up to the 45–64 age group, with no significant increase in older groups. For nociceptive pain, the rates increased up to the 65–74 age group.
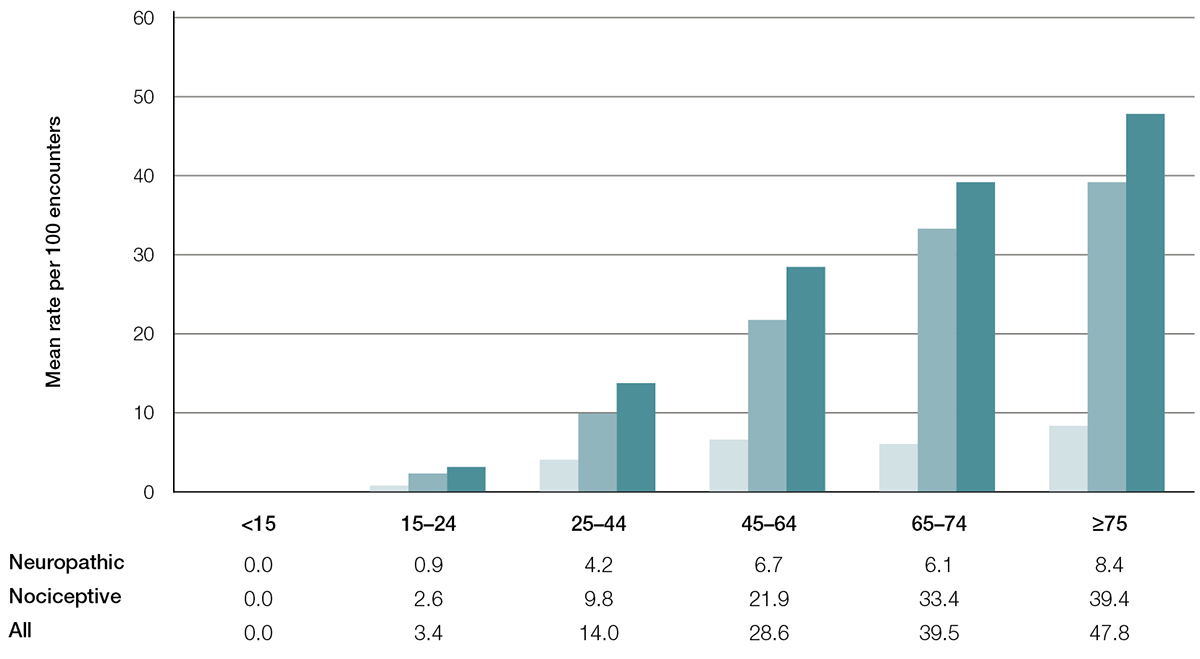
Figure 1. Chronic pain (neuropathic, nociceptive and all) – Age-specific rates per 100 encounters (95% confidence interval)
Compared with the 75+ age group for each pain group, all age group rates are significantly different at the 5% level (except for 45–74 neuropathic,and 65–74 nociceptive)
Female patients at GP encounters during the study period were 27% more likely than male patients to report any chronic pain, and 43% more likely to report neuropathic pain. Patients from the low SEIFA group were 43% more likely to report any chronic pain than those from advantaged areas (Table 3).
Table 3. Sex-specific and Socio-Economic Indexes for Areas (SEIFA)-specific rates for chronic pain and subgroups (neuropathic and nociceptive)
|
Characteristic
|
Value
|
All chronic pain
|
|
Neuropathic
| |
Nociceptive
| |
|---|
| |
|
Sex-specific rate per 100 encounters (95% confidence interval [CI])
|
Relative risk of female to male (95% CI)
|
Sex-specific rate per 100 encounters (95% CI)
|
Relative risk of female to male (95% CI)
|
Sex-specific rate per 100 encounters (95% CI)
|
Relative risk of female to male (95% CI)
|
|
Sex
|
Male
|
21.8 (18.1–25.6)
|
1.27 (1.09–1.48)
|
4.1 (2.8–5.5)
|
1.43 (1.00–2.04)
|
17.7 (14.4–21.1)
|
1.23 (1.03–1.47)
|
| |
Female
|
27.7 (24.0–31.4)
|
P = 0.0017
|
5.9 (4.5–7.3)
|
P = 0.043
|
21.8 (18.6–25.1)
|
P = 0.018
|
| |
|
SEIFA-specific rate per 100 encounters (95% CI)
|
Relative risk of low to high (95% CI)
|
SEIFA-specific rate per 100 encounters (95% CI)
|
Relative risk of low to high (95% CI)
|
SEIFA-specific rate per 100 encounters (95% CI)
|
Relative risk of low to high (95% CI)
|
|
SEIFA
|
1–5 (low)
|
30.8 (25.2–36.4)
|
1.43 (1.15–1.77)
|
6.1 (4.2–7.9)
|
1.3 (0.9–1.9)
|
24.7 (19.8–29.7)
|
1.46 (1.15–1.84)
|
| |
6–10 (high)
|
21.6 (18.4–24.8)
|
P = 0.0008
|
4.6 (3.4–5.8)
|
P = 0.15
|
17.0 (14.3–19.7)
|
P = 0.0009
|
On average, patients with neuropathic pain scored themselves significantly worse than those with nociceptive pain alone on all four assessed items: pain, activity, sleep and mood (Table 4).
Table 4. Pain, activity, sleep and mood mean scores for neuropathic and nociceptive pain subgroups
|
Modality
|
Neuropathic mean score* (95% confidence interval [CI])
|
Nociceptive mean score* (95% CI)
|
Difference in mean scores† (neuropathic – nociceptive; 95% CI)
|
|---|
|
Pain intensity
|
6.3 (5.8–6.7)
|
5.1 (4.8–5.4)
|
1.2 (0.7–1.6)
|
|
Activity level
|
5.4 (4.9–5.9)
|
4.3 (4.0–4.7)
|
1.0 (0.6–1.5)
|
|
Sleep quality
|
5.5 (5.0–6.0)
|
4.0 (3.7–4.3)
|
1.5 (1.0–1.9)
|
|
Mood
|
5.3 (4.8–5.8)
|
3.8 (3.5–4.2)
|
1.4 (0.9–1.9)
|
|
Notes: Individual scores can range from 1 (best) to 10 (worst)
*All mean scores were significantly greater than 1 (P <0.0001)
†All neuropathic versus nociceptive mean score differences were significant (P <0.0001)
|
Of the respondents in the nociceptive group, four out of 481 (0.8%; 95% CI: 0.0–1.6) were taking pregabalin, compared with 27 out of 126 (21.4%; 95% CI: 13.2–29.7) in the neuropathic group. A patient with any neuropathic chronic pain was approximately 26 times more likely to be taking pregabalin than a patient with purely nociceptive chronic pain.
Discussion
This study has provided detailed information about the frequency of neuropathic and nociceptive chronic pain as reported by patients at GP encounters. Chronic pain was present most often in older and female patients. The likelihood of any chronic pain consistently increased with age. The risk of neuropathic pain increased until middle age, then plateaued, whereas for nociceptive pain, the risk appeared to plateau later. As a group, females were significantly more likely to experience chronic pain (especially neuropathic) than males. Those from disadvantaged areas were at increased risk of chronic pain (especially nociceptive) but not of neuropathic pain in this study, perhaps because of a lack of statistical power.
According to self-report, patients with chronic neuropathic pain suffered more and functioned more poorly than those with nociceptive pain alone. However, this may be related to the fact that almost two-thirds of the neuropathic group reported concomitant nociceptive pain.
Less than 1% of participants in this study with purely nociceptive chronic pain were taking pregabalin, much less than the 21% of the neuropathic group, largely consistent with the approved indications. The PBS’s minimum estimate of eligible patients with neuropathic pain receiving pregabalin over one year is 25%, which is consistent with our 21.4% (95% CI: 13.2–29.7) estimate of current use.6
Conclusion
Approximately one-quarter of all patients at general practice encounters during this study period reported recent chronic pain, with female and older patients especially at risk. Chronic neuropathic pain was reported for 5% of respondents. On average, those with chronic neuropathic pain suffered more and functioned more poorly than those with chronic nociceptive pain alone. There was minimal use of pregabalin in the group that reported purely nociceptive chronic pain.
Authors
Joan Henderson BAppSc (HIM) (Hons), PhD (Med), Senior Research Fellow, Deputy Director, Family Medicine Research Centre, Sydney School of Public Health, Sydney Medical School, University of Sydney, Parramatta, NSW. joan.henderson@sydney.edu.au
Allan J Pollack MBBS (Hons), MBiomedE, FRACS (Orth), MPH (PP), Research Analyst, Family Medicine Research Centre, Sydney School of Public Health, Sydney Medical School, University of Sydney, Parramatta, NSW
Ying Pan BMed, MCH, Senior Research Analyst, Family Medicine Research Centre, Sydney School of Public Health, Sydney Medical School, University of Sydney, Parramatta, NSW
Graeme C Miller MBBS, PhD, FRACGP, Associate Professor and Medical Director, Family Medicine Research Centre, Sydney School of Public Health, Sydney Medical School, University of Sydney, Parramatta, NSW
Competing interests: None.
Provenance and peer review: Commissioned, externally peer reviewed.
Acknowledgements
We wish to thank the general practitioners who participated for their generosity. During the data collection period of this study, the BEACH program was funded by the Australian Government Department of Health, Australian Government Department of Veterans’ Affairs, AstraZeneca Pty Ltd (Australia), Novartis Pharmaceuticals Australia Pty Ltd, Seqirus Australia, and AbbVie Pty Ltd. Funding organisations had no editorial control over any aspect of this article.