The blood glucose profile
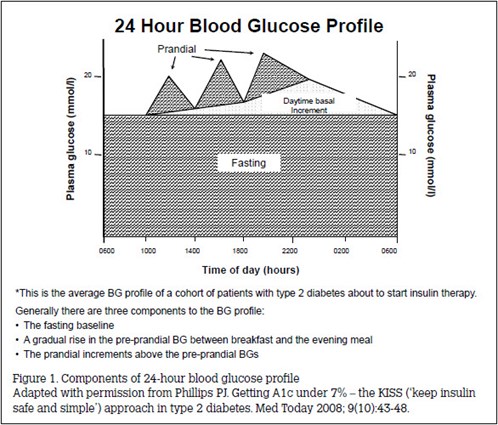
In type 2 diabetes, the blood glucose profile has three components1 (Figure 1):2
A flat baseline is set by the fasting blood glucose.
Frequently, a daytime baseline change, usually an increase, in preprandial blood glucose (prepBG) occurs between breakfast and the evening meal. Less commonly, there is a decrease over this period.
The prandial blood glucose increases above baseline, generally reaching a maximum within 1–2 hours and returning to baseline 3–4 hours after the meal.
Keeping insulin safe and simple (the insulin KISS)3
Hypoglycaemic therapy aims to control the blood glucose components that are above target:
- First fix the fasting: basal insulin (analogue or human), usually at night, will lower fasting blood glucose and the 24-hour basal blood glucose.
- Then tackle tea: if the preprandial blood glucose level in the evening remains above target despite fasting blood glucose being on target, a second morning basal insulin dose is given to control any daytime increase in basal blood glucose. This is necessary in 10–20% of patients.
- Find the hidden hypers: if the HbA1c remains above target despite the morning and evening preprandial blood glucose levels being on target, further hypoglycaemic intervention is required.
- Check the HbA1c: monitoring the HbA1c every 3 months assesses long-term overall glycaemia.
Normalising basal glycaemia almost eliminates the overall excess glycaemia, lowering HbA1c from 11.5 to 7.3%. Eliminating the daytime blood glucose increase further lowers HbA1c to 6.4%, which is well within the recommended target. Correcting the excess prandial increase would further lower HbA1c to 5.3%4 but that would risk hypoglycaemia and weight gain, and require extra therapeutic effort.
HbA1c and blood glucose5
The HbA1c reflects the average blood glucose (avBG) over the last 6 weeks – before and after meals, during the day and overnight. The result is reported either as a percent of the total haemoglobin or as a molar proportion (mmol/mol). There is a simple relationship between the two measures of HbA1c and the avBG: for each 1% change in the HbA1c percentage, the HbA1c changes by 11 mmol/mol and the avBG changes by 2 mmol/L (Table 1). Laboratories report HbA1c measurement in terms of both percentage and mmol/mol. This article illustrates the principles of interpretation using the HbA1c percentage measurement.
- The avBG over 24 hours is given by the formula: avBG mmol/L = 2HbA1c% – 6
- The prepBGs (before breakfast, lunch and the evening meal) are approximately 1 mmol/L lower than avBG, which reflects both basal and prandial glycaemia: Preprandial mmol/L = 2HbA1c% – 7 For example, if the HbA1c is 6%, the HbA1c in mmol/mol is 42 mmol/mol, the avBG is 6 mmol/L and the prepBG is 5 mmol/L.
Table 1. Measures of glycaemia5
|
|
HbA1c%
|
HbA1c mmol/mol
|
HbA1c % and HbA1c mmol/mol
|
|---|
|
4.0
|
20
|
HbA1c mmol/mol = 11 HbA1c% – 24
|
|
5.0
|
31
|
|
|
6.0
|
42
|
HbA1c % = (HbA1c mmol/mol + 24) ÷ 11
|
|
6.5
|
49
|
|
|
7.0
|
53
|
|
|
7.5
|
59
|
|
|
8.0
|
64
|
|
|
9.0
|
75
|
|
|
10.0
|
86
|
|
|
11.0
|
97
|
|
|
12.0
|
108
|
|
|
HbA1c and avBG
avBG mmol/L = 2 HbA1c% – 6 or
avBG = (2HbA1c mmol/mol – 18) ÷ 11
|
HbA1c and prep BG
prepBG mmol/L = 2HbA1c – 7 or
prepBG mmol/L = (2HbA1c – 29) ÷ 11
|
|
The table gives the values of the HbA1c% and the corresponding values of HbA1c mmol/mol
See also the NPS HbA1c unit tool converter8 (www.nps.org.au and search for
HbA1c test)
The equations can be derived on the basis of the following points:
At an HbA1c of 4% the HbA1c mmol/mol is 20 mmol/mol.
For each 1% change in HbA1c% the HbA1c mmol/mol changes by 11 mmol/mol.
The avBG mmol/L = 2HbA1c% – 6. This is equivalent to but much simpler than the relationship derived from clinical trials (1.59 HbA1c% – 2.59)2
|
|---|
Setting glycaemic targets
Targets should be set in collaboration with the patient, balancing the benefits and costs of achieving lower glycaemic levels in the short and long term for that patient (Table 2). The general target for glycaemic control is an HbA1c ≤7%, equivalent to an avBG of 8 mmol/L and a prepBG of 7 mmol/L.
Table 2. Setting lower glycaemic targets
|
|
Benefits
|
Costs
|
|---|
|
Lower risk of long-term complications
Fewer symptoms of hyperglycaemia and glycosuria*
Improved wellbeing
|
Risk of hypoglycaemia
Weight gain
Extra therapeutic effort
|
|
*Hyperglycaemia is associated with lethargy and drowsiness, glycosuria with polyuria, polydipsia and genital thrush
|
|---|
The Australian Diabetes Society recommends individualising targets for HbA1c on the basis of duration of diabetes, presence of cardiovascular disease and hypoglycaemic risk (Table 3).5
Table 3. Individualising glycaemic targets5
|
| Clinical situation | HbA1c target (%) |
|---|
|
General target
|
≤7.0
|
|
Pregnancy or planning pregnancy
Short duration diabetes and no CVD:
- Low risk of hypoglycaemia
- At risk of hypoglycaemia†
Longer duration diabetes or CVD
High risk of hypoglycaemia
Limited life expectancy
|
≤6.0
≤6.0
6.5–7.0
≤7.0
≤8.0
Symptomatic control
|
|
Derived from the Position Statement of the Australian Diabetes Society6
†Sulphonylurea therapy ≤6.5; insulin therapy ≤7.0
CVD, cardiovascular disease
|
|---|
HbA1c, blood glucose monitoring and insulin therapy
Blood glucose monitoring (BGM) assesses the relevant blood glucose at each step: fasting, before the evening meal and, if needed, before the midday meal, after the evening meal or during the night. In practice, the steps are (Table 4):
- Is prepBG highly variable? (eg average swings wider than ± 3 mmol/L around the mean allowing for an exceptional but explicable prepBG). If so, adjusting insulin therapy to achieve prepBG ≤7 mmol/L is likely to cause hypoglycaemia and overall glycaemic targets will not be met (HbA1c will exceed 7%). The source of glycaemic variability should be addressed (eg variable lifestyle, therapeutic non-adherence, incorrect use of insulin or incorrect BGM technique).
- Is prepBG consistent with the HbA1c? If not:
- Is the BG profile misleading?
- Compare the patient’s records with readings held in the meter memory.
- Check BGM technique.
- Compare the patient’s BGM values immediately before and after fasting blood is taken for laboratory glucose analysis (Table 5).7
- Is there hidden hyper- or hypoglycaemia that explains lower or higher observed BGM values than those expected from the HbA1c?
- Check blood glucose levels at midday, after the evening meal and during the night (eg 0200).
- Is the HbA1c misleading?
- Consider whether patient-related factors could be causing HbA1c values to be different from that expected from avBG5 (eg shortened red cell survival causing anaemia and lower HbA1c values). Ask the laboratory if their assay could cause the discrepancy you observe. If so, ask for the HbA1c to be measured by a different method that will give the actual value.
- Are the fasting blood glucose and the evening prepBG on target? If not:
- Add or adjust the nighttime and/or morning basal insulin accordingly.
- Is the HbA1c on target (after 6 weeks of fasting blood glucose and prepBG being on target)? If not:
- Look for and correct any hidden hypers after meals and/or during the night.
- Is the ongoing 3-monthly HbA1c on target? If not:
- Re-assess the blood glucose profile and return to step 1 (as above).
Table 4. Insulin, HbA1c and BGM: adjusting insulin*
- If prepBG IS very variable (ie over ±3 mmol/L
around mean), review:
- lifestyle adherence
- insulin routines
- BGM technique
- If prepBG values are not consistent with HbA1c:
- is BGM misleading?
- are there hidden hypers or hypos?
- is HbA1c misleading?
|
- If prepBG, morning and evening are not on target:
- adjust pm and/or am basal insulin dose(s).
- If the HbA1c is not on target 6 weeks later:
- If the ongoing 3-monthly HbA1cs are not on target:
|
|
*Steps are sequential. If satisfied go to the next step. If not, take action as noted in the bullet points
|
|---|
Table 5. BGM – check the whole system
|
|
To check the accuracy and variability of blood glucose monitoring the person should take their blood glucose monitoring equipment to the collection centre where blood is taken for measurement of fasting blood glucose.
The BGM measurements are taken immediately (minutes) before and after the blood is taken and the results are compared to the laboratory value.
Variability is shown by the difference between the two BGM values.
Accuracy is shown by the agreement with the laboratory value.
Generally it’s best to check the fasting BG since this is likely to be lowest where BGM accuracy is most important.
|
Case. HbA1c, BGM and insulin in practice
Over the past 2 years Mr JR’s HbA1c has increased from 7.4 to 8.9%. On your advice, Mr JR has decided to start insulin treatment. Mr JR’s prepBG profile is shown in Table 6.
Table 6. PrepBG profile
|
|
Baseline
|
|---|
|
|
Breakfast
|
Lunch
|
Tea
|
Mean prep
|
|
Mon
|
11.2
|
14.2
|
13.7
|
|
|
Tue
|
13.4
|
12.9
|
10.1
|
|
|
Wed
|
9.8
|
6.9
|
14.3
|
|
|
Thu
|
6.1
|
10.7
|
8.1
|
|
|
Fri
|
7.5
|
7.1
|
6.6
|
|
|
Mean
|
9.6
|
10.4
|
10.6
|
10.2
|
|
1 week
|
|---|
|
|
Breakfast
|
Lunch
|
Tea
|
Mean prep
|
|
|
10.3
|
9.8
|
11.1
|
10.7
|
|
4 weeks
|
|---|
|
|
Breakfast
|
Lunch
|
Tea
|
Mean prep
|
|
|
6.4
|
7.6
|
8.3
|
7.4
|
|
3 months
|
|---|
|
|
Breakfast
|
Lunch
|
Tea
|
Mean prep
|
|
|
5.8
|
9.7
|
10.4
|
8.7
|
Question 1
How do you interpret the profile?
Question 2
What is your response?
Answer 1
The mean prepBGs over the day are reasonably flat (9.6–10.6). However, the prepBGs are highly variable (eg prepBG 6.1–13.4). Insulin adjustment will not be practical until the variability is reduced.
Answer 2
Refer Mr JR to a diabetes nurse educator to review his diabetes routines (lifestyle, medication adherence and BGM technique).
Case continued
One week later, Mr JR’s prepBGs are less variable; the mean prepBG profile at 1 week is shown in Table 6. You continue Mr JR’s oral hypoglycaemic agents, start 10 units of basal insulin at bedtime and over 4 weeks titrate the insulin so his fasting blood glucose is 6–7 mmol/L. You stop the glitazone, continue the sulphonylurea, reduce his metformin from 1000 to 850 mg bd and increase his night basal insulin to keep his fasting blood glucose 6–7 mmol/L. His prepBG profile at 4 weeks is shown in Table 6.
Question 3
How do you interpret the profile?
Question 4
What is your response?
Answer 3
Mr JR’s prepBG is on target, but his evening prepBG is high.
Answer 4
Start a second morning basal dose of 10 units and titrate the basal insulin before breakfast and bed to achieve prepBGs before breakfast and the evening meal 6–7 mmol/L. Three months later Mr JR’s HbA1c is 7.1%. His prepBG profile is shown in Table 6.
Question 5
How do you interpret the blood glucose profile?
Question 6
How do you respond?
Answer 5
The mean prepBG is inconsistent with the HbA1c of 7.1%. It should be 7.2 (ie 2 x HbA1c – 7) not 8.7 mmol/L (2 x 7.1% – 7 = 7.2 mmol/L).
Answer 6
Check:
- Is the BGM misleading?
- Are there hidden hypos?
- Is the HbA1c misleading?
Mr JR was having nocturnal hypoglycaemia. You reduce his night-time basal insulin by 20%, check values remain above 4 mmol/L at 0200 and arrange to review the HbA1c and blood glucose profile in 3 months.
Summary
- Interpreting the information provided about overall glycaemia (avBG; reflected in the HbA1c) and the 24-hour pattern of blood glucose (preprandial and the prandial increase) is required to adjust hypoglycaemic therapy in general and insulin therapy in particular.
- The blood glucose profile reflects three glycaemic components: basal glycaemia over the 24 hours reflected by the fasting blood glucose; the day-time increase in basal glycaemia reflected in the day-time increase of prepBG; and the prandial increase reflected in the difference between post and prepBG.
- There are four steps to keep insulin safe and simple: first fix the fasting, then tackle tea, find the hidden hypers and check the HbA1c.
- HbA1c is reported as a percent or molar ratio of total haemoglobin (% or mmol/mol) and these are related by a simple formula: HbA1c% = (HbA1c mmol/mol + 24) ÷ 11.
The HbA1c is also related to average (av) and preprandial (prep) BG by a simple formula:
2HbA1c – 6 and 2HbA1c – 7 mmol/L, respectively.
- Glycaemic targets should be negotiated with each patient and guided by guidelines published by the Australian Diabetes Society with the usual target being HbA1c ≤7%.
- Interpreting the HbA1c and blood glucose profile requires assessment of the variability of prepBG; the consistency of the values of the blood glucose profile and the HbA1c; whether the morning and evening prepBG and HbA1c are on target; and ongoing 3-monthly HbA1c values.
Competing interests: None.
Provenance and peer review: Not commissioned; externally peer reviewed.
References