Notes:
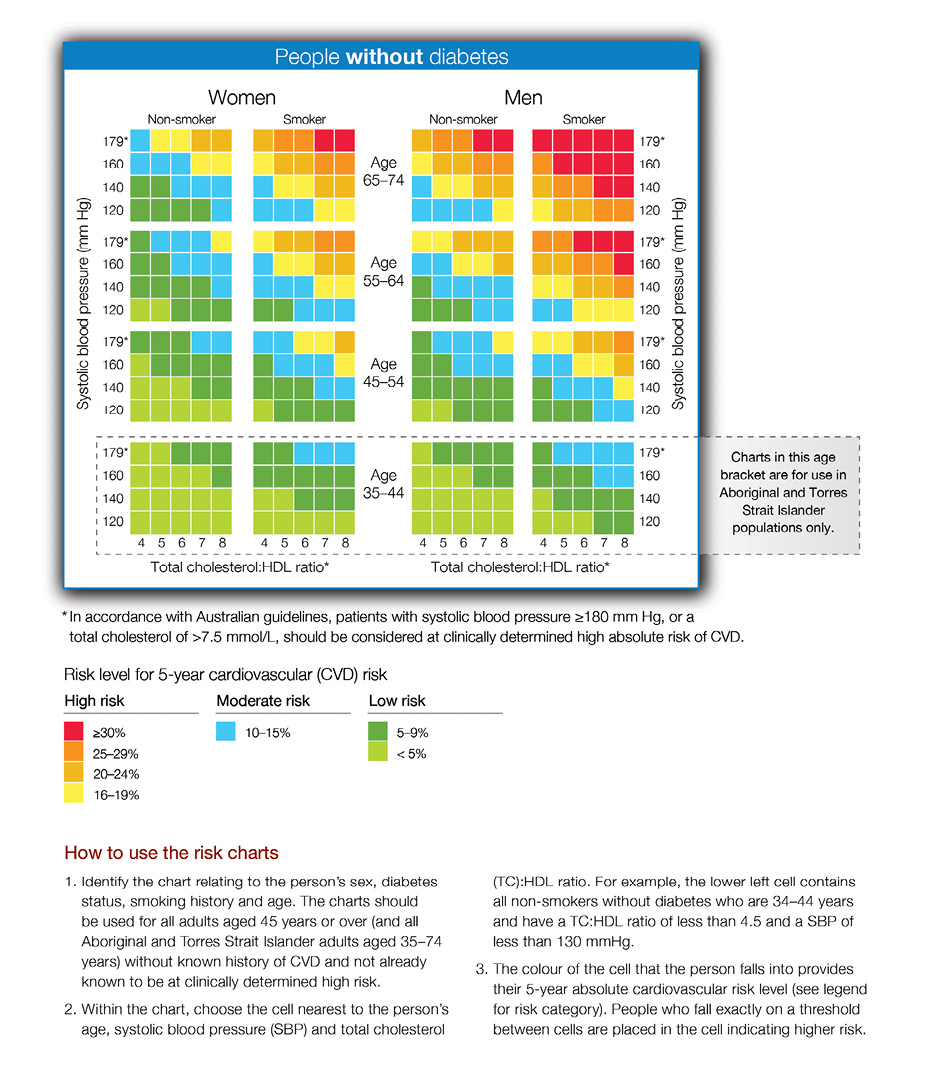
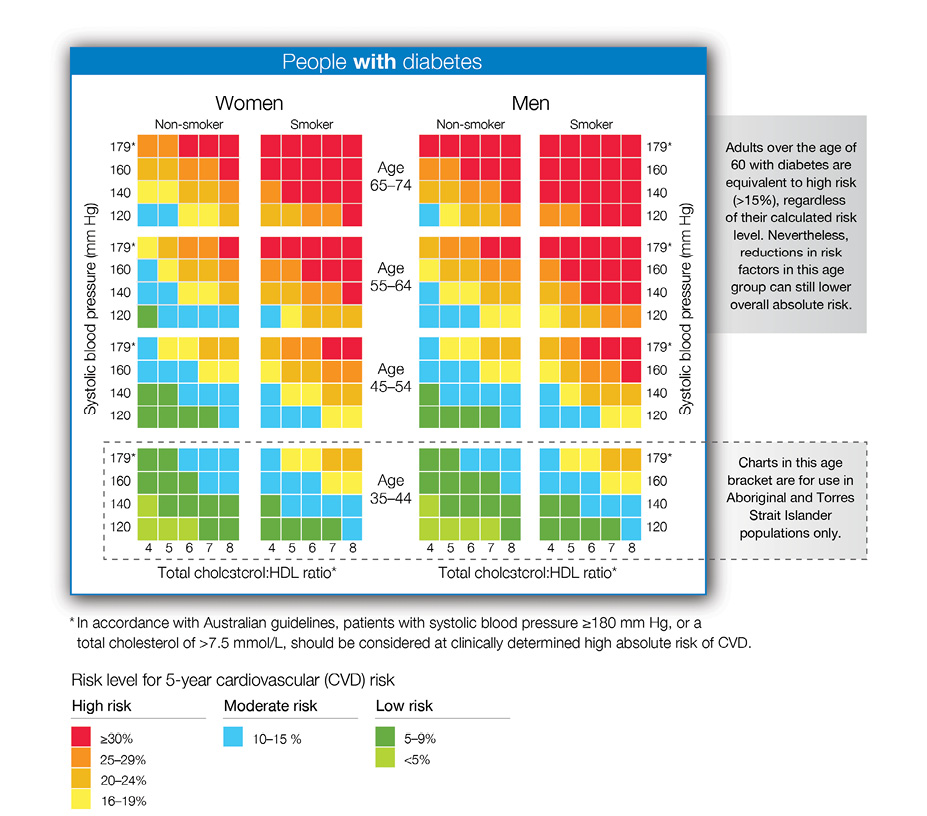
The risk charts include values for SBP alone as this is the most informative of conventionally measured blood pressure parameters for cardiovascular risk.
For specific groups, additional guidance includes: The Framingham Risk Equation has not been validated for all population groups, the assessment score should be interpreted with caution in the following groups:
• The Framingham Risk Equation may underestimate CVD risk in Aboriginal and Torres Strait Islander peoples (EBR Grade D); adults with diabetes aged between 45 and 60 years (EBR Grade C); adults aged over 74 years (CBR), however, available evidence suggests that this approach will provide an estimate of minimum cardiovascular risk.
- The Framingham Risk Equation is likely to underestimate CVD risk in adults with socioeconomic deprivation (an independent risk factor for cardiovascular disease) (PP) or depression (PP).
- The predictive value of the Framingham Risk Equation has not been specifically assessed in adults who are overweight or obese (EBR Grade D).
- The increased risk of cardiovascular events and all-cause mortality, in addition to thromboembolic disease including stroke, should be taken into account for adults with atrial fibrillation (particularly those aged over 65 years) (PP). Charts are based on the NVDPA’s Guidelines for the assessment of absolute cardiovascular disease risk and adapted with permission from New Zealand Guidelines Group. New Zealand Cardiovascular Guidelines Handbook: A Summary Resource for Primary Care Practitioners. Second edition. Wellington, NZ: 2009.
Reproduced with permission from the National Heart Foundation of Australia from National Vascular Disease Prevention Alliance. Absolute cardiovascular disease risk management. Quick reference guide for health professionals. Melbourne: NVDPA, 2012.